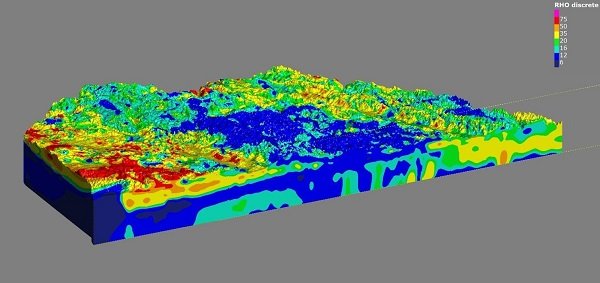
Sensing data processed and inverted in AGS Workbench software can then be combined in Seequent’s Leapfrog Works to create a 3D model that gives a detailed overview of resources. The above image is a hydrogeological map of the subsurface of the Principal Aquifer (and parts of the Ogallala Aquifer) in Nebraska, United States. Airborne Electromagnetic (AEM) remote sensing was used to capture data from the 4,000-square-mile study area. The color-coded volumes represent eight resistivity categories. Higher resistivity values are represented as yellow to red (sand and gravel), lower resistivity values are represented as blue to green (clay and silt), and brown represents bedrock.
Home Bentley Systems Announces Seequent’s Acquisition of Aarhus GeoSoftware Sensing data processed and inverted in AGS Workbench software can then be combined in Seequent’s Leapfrog Works to create a 3D model that gives a detailed overview of resources. The above image is a hydrogeological map of the subsurface of the Principal Aquifer (and parts of the Ogallala Aquifer) in Nebraska, United States. Airborne Electromagnetic (AEM) remote sensing was used to capture data from the 4,000-square-mile study area. The color-coded volumes represent eight resistivity categories. Higher resistivity values are represented as yellow to red (sand and gravel), lower resistivity values are represented as blue to green (clay and silt), and brown represents bedrock.
Sensing data processed and inverted in AGS Workbench software can then be combined in Seequent’s Leapfrog Works to create a 3D model that gives a detailed overview of resources. The above image is a hydrogeological map of the subsurface of the Principal Aquifer (and parts of the Ogallala Aquifer) in Nebraska, United States. Airborne Electromagnetic (AEM) remote sensing was used to capture data from the 4,000-square-mile study area. The color-coded volumes represent eight resistivity categories. Higher resistivity values are represented as yellow to red (sand and gravel), lower resistivity values are represented as blue to green (clay and silt), and brown represents bedrock.